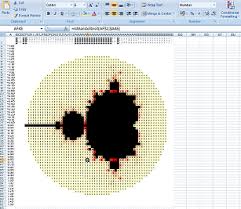
Here is the result. It took me only minutes to implement it and as you can see in the different sheets, I have also implemented the Julia set in the same workbook.
The sheets are for 3 different resolutions and you see that the range where both sets are visible is from -2.2 / -1.5 to 0.8 / 1.5 for the Mandelbrot set and from -1.8 / -1.5 to 1.8 / 1.5 for the Julia Set.
I realized the different colors with conditional formatting which is a nice feature of Microsoft Excel. Points which are part of the set are black, points which are not part of the set are colored. The color depends on the number of iterations necessary to decide that they are diverting and is going from red and yellow to white.
You can download the Excel workbook from here. You might have to allow the basic script!

Kommentare sind geschlossen.